Observing Correlations
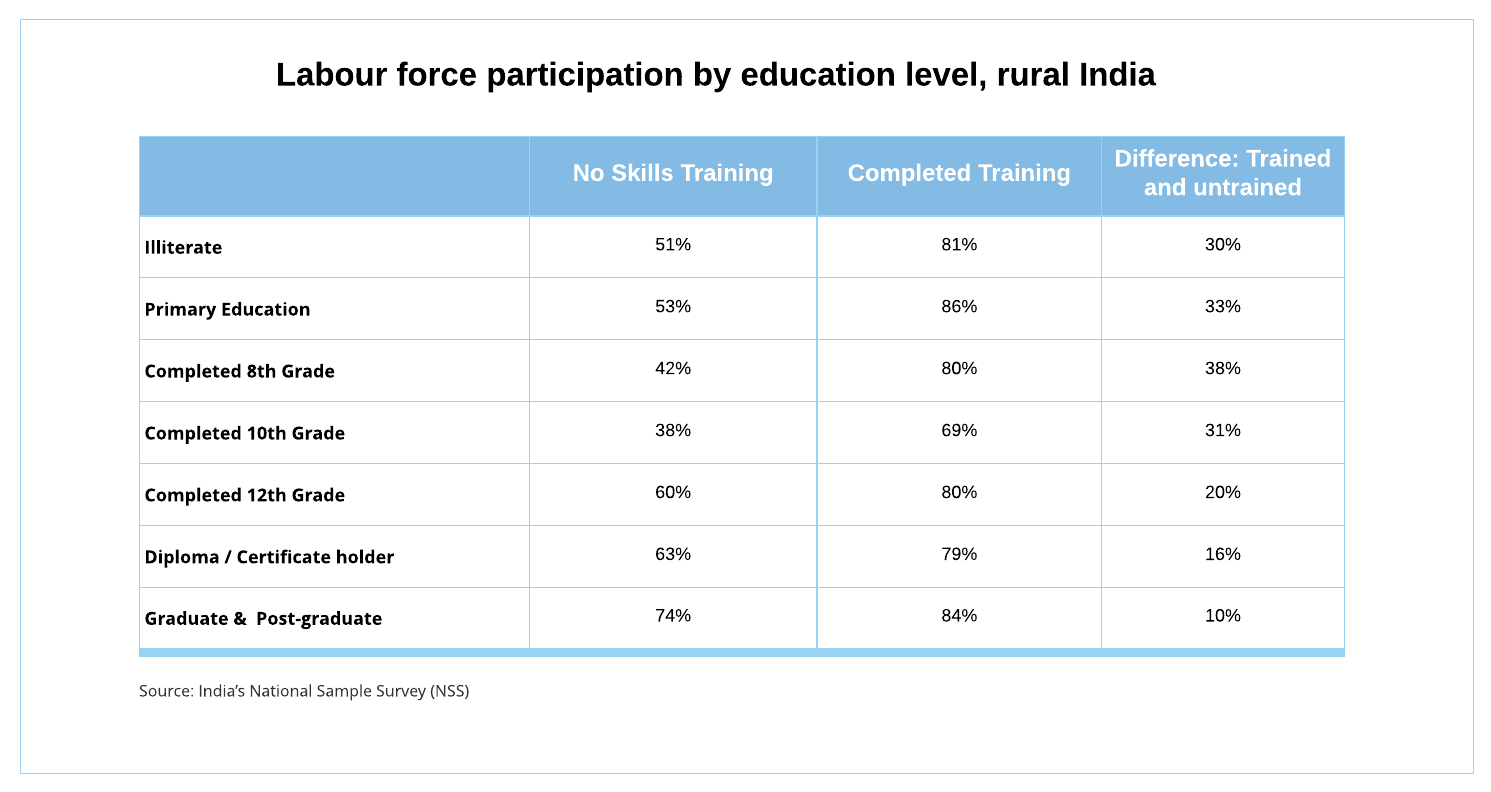
EPoD’s analysis of survey data showed that at all levels of education, skilling was associated with higher labor force participation. “As the table below makes clear, those who left school earlier stand to gain the most from acquiring skills. Among those who dropped out after primary school, a trained individual is 33 per cent more likely to work; among those who completed high school, a trained individual is only 20 per cent more likely.”

The data also showed that vocational training was associated with placement in relatively more highly skilled professions.
All of this seemed intuitive and implied that training rural youth would increase their participation in the labor force. However EPoD was quick to remind their policy associates that this kind of data does not establish a cause-and-effect relationship. An ambitious girl might complete a training course in IT, then fail to find work in the field. Later, were a factory to open in her town, she may be first in line to apply for a job. She would have gotten the manufacturing job without the IT training – her personality traits made her more likely than other villagers to do both. So it would be a mistake for the government to reward the IT training center for making her employable.
Correlations like the ones revealed in the graph above can serve as a kind of dim light, indicating that you’re on the right path, especially when no other evidence exists. However, governments in rich and poor countries alike base important decisions on correlations, a practice that can lead to wasteful detours and dead ends. To be sure a program is having its desired effect, rigorous testing must be ingrained in the process of policy design, and the implementers must be willing to cycle back and make corrections based on the evidence – the essence of EPoD’s Smart Policy Design process.