Internal migration and spatial reorganisation of agriculture
While migrants and their urban destinations are extensively studied, less is known about how their departure transforms the rural economies they leave behind. Analysing Indian data, this article shows that migrant-sending households near cities reduce farm size and investment rather than replacing workers with capital. On the other hand, non-migrant, remote households expand production in response to falling land prices and rising crop prices.

This article first appeared in Ideas for India on June 18, 2025
The migration of workers from farms to cities is a hallmark of economic development. For instance, India’s 1991 economic liberalisation led to a 30% drop in the share of the workforce employed in agriculture alongside a rapid expansion of service jobs in urban areas (Figure 1). While development economists have extensively studied migrants and their urban destinations, less is known about how their departure transforms the rural economies they leave behind.
Figure 1. Economic growth and reallocation of workers (1991-2012)
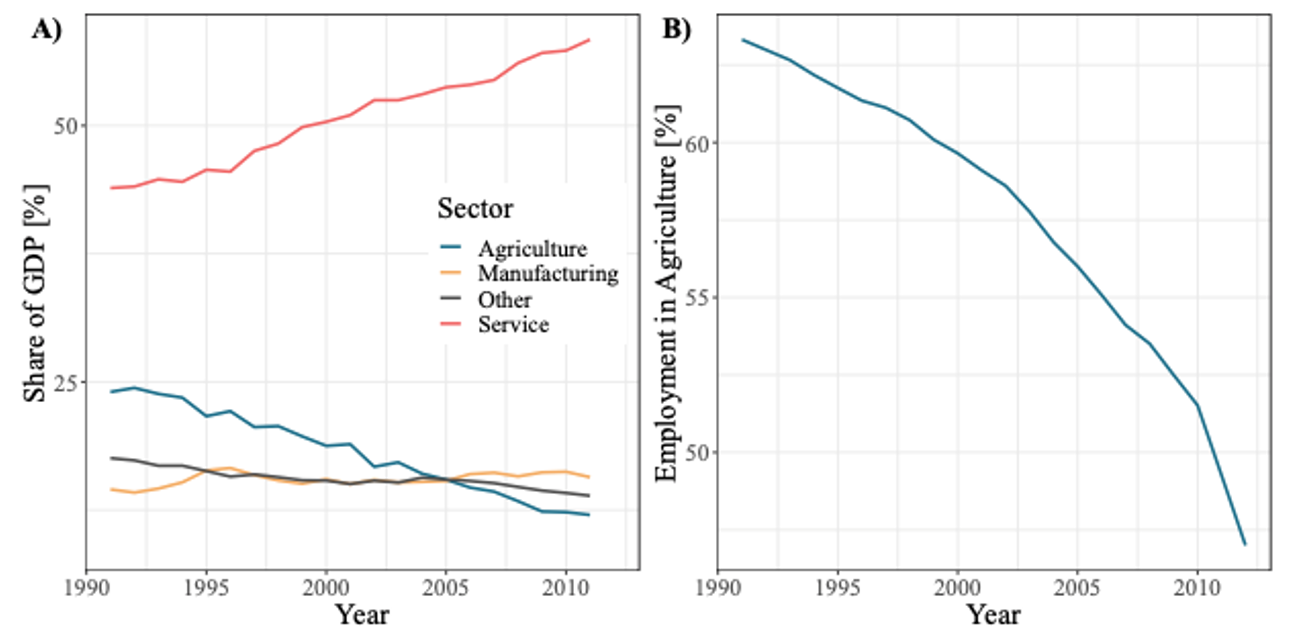
Notes/Sources: (i) Panel A reports sectoral shares of India’s GDP (gross domestic product) in 2005 prices using data from the Planning Commission. (ii) Panel B reports the percentage of total employment in agriculture using data from ILOSTAT.
Canonical models in development economics had assumed that rural areas have surplus labour, allowing some workers to exit farming without reducing agricultural output (Lewis 1954). Yet empirical research shows that emigration does reduce farm employment and output (Rozelle et al. 1999, Mendola 2008). Sustaining food supplies as workers exit agriculture thus requires some form of agricultural transformation. Although aggregate analyses suggest that this occurs through labour-capital substitution (Manuelli and Seshadri 2014, Hornbeck and Naidu 2014, Alvarez-Cuadrado and Poschke 2011), coarse data conceal underlying mechanisms: do left-behind families of migrants directly substitute capital for labour? Or is the process indirect – where land and crop markets readjust following emigration, leading other non-migrant households in the village or elsewhere to reorganise production in response to new price signals and fill the production gaps?
In our new research (Madhok et al. 2025), we analyse detailed household-level panel data to paint a richer picture of the direct and indirect pathways through which rural economies respond to migration.
Migration and agriculture in India
We use the 2005 and 2012 rounds of the India Human Development Survey (IHDS), which contains information on medium-term migration as well as agricultural inputs, employment, and profits for 42,000 households. We focus on migration of working-age men, as they constitute the majority of India’s migrant workforce.
Three stylised facts from the data guide our research design. First, migration typically involves individual household members rather than entire families. We therefore treat migration as continuous (number of migrants sent) rather than a binary household decision. Second, migration declines with remoteness (Figure 2), evidence that migration costs increase with distance. Third, worker constraints increase with farm size, consistent with prior work showing that small farms are labour-abundant (Foster and Rosenzweig 2022). This suggests that the impact of worker exit will be more salient for large farms.
Figure 2. Migration and distance to nearest large cities
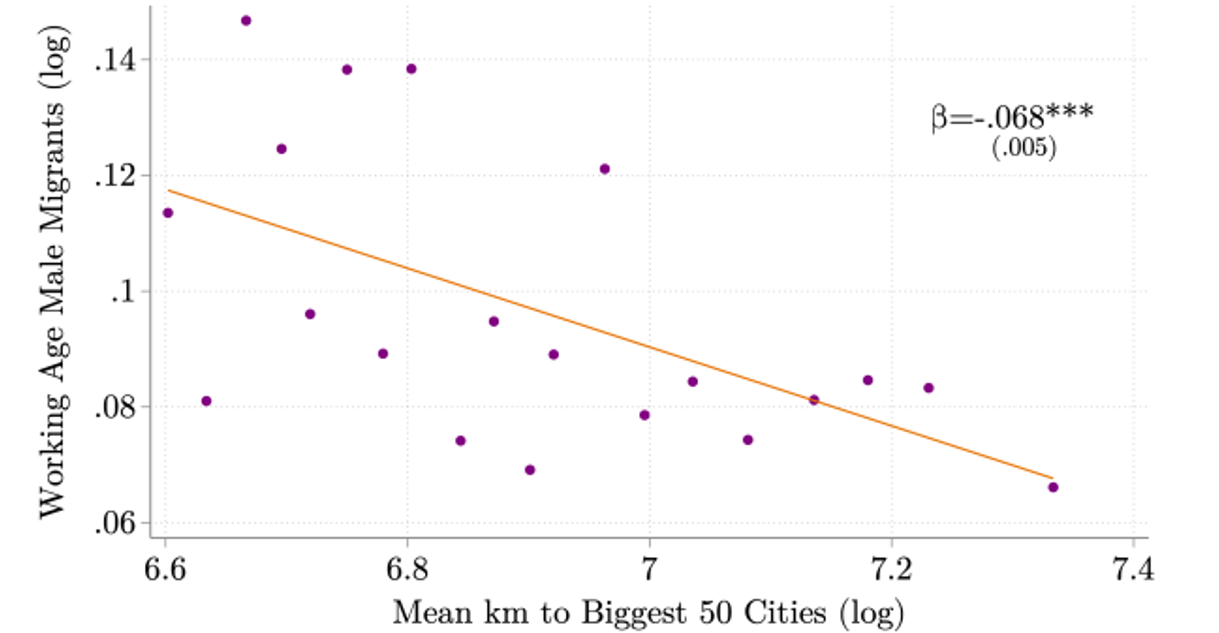
Notes/Sources: (i) The vertical axis (y axis) depicts the log number of working-age male migrants in a household (plus one, to account for log-zero errors). (ii) The horizontal axis (x axis) depicts the log of mean (average) distance from each district to the 50 biggest districts by population (iii) Orange line is the best linear fit, constructed from an ordinary least squares (OLS) regression of the y-axis variable on the x-axis variable.
Quantifying the impact of migration on agricultural production is complicated by the fact that agricultural outcomes could also incentivise migration. We therefore ‘instrument’ for migration (Borusyak et al. 2025) using the combination of destination income shocks with household-level exposure to these shocks. Since destination income shocks incentivise migration, but are uncorrelated with agricultural outcomes at the origin, these shocks can be used to isolate the pull stream of migration that is plausibly exogenous to origin push factors such as poverty. Exposure to destination income changes is measured by: (i) inverse distance to potential destinations and, (ii) the household’s migration potential, proxied by the number of working-age males at home during the baseline period. Interacting these lets us compare households with similar migration potential but different exposure to income shocks, or vice versa.
Direct effects of migration: Downsizing, not mechanisation
Contrary to conventional wisdom, we find no evidence that migrant-sending households replace labour with capital. Instead, they scale down farming operations altogether (Figure 3, orange). A one standard deviation1 reduction in the number of farm workers causes households to reduce agricultural expenses, machinery, and farm size, resulting in lower profits.
Figure 3. The direct effect of migration on agricultural development
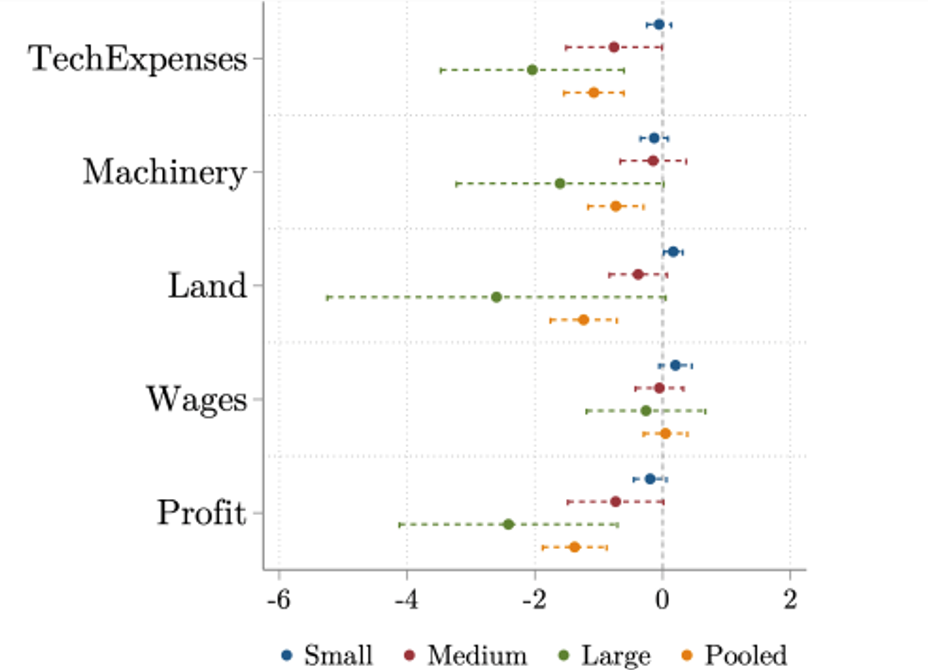
Notes: (i) The explanatory variable is the number of working-age male migrants in the household, instrumented with inverse-distance population weighted income interacted with the number of working-age males in the household at baseline. (ii) Outcomes on the vertical axis are standardised. (iii) Blue, red, green, and orange coefficients are for small (0-2 acres), medium (2-4 acres), large (4+ acres), and pooled farm sizes, respectively. (iv) Tech expenses and machinery are indices for agricultural expenses and stock of machinery, respectively. Land is farm size in acres. Wages are the total annual wage bill divided by person-days of workers (household + hired workers). Output is crop profits net of expenses. (v) All specifications control for drought, temperature, and rainfall.
We find that downsizing is driven by large farms (Figure 3, green), consistent with our stylised fact that these farms are more labour-constrained. Small farms, which are characterised by surplus workers, show little response, as the departure of underutilised workers has little effect on production.
At first glance, our findings raise concerns about the domestic food supply amidst India’s rapid urbanisation. Yet, the net impact of migration on agriculture also depends on market adjustments to worker movement and how other non-migrating farming households, in turn, adapt their production in response to changing land and crop prices.
Indirect effects of migration: Crop and land markets reallocate production
If the declining food supply in Figure 3 raises crop prices, then other households unaffected by worker loss may respond to higher output prices by scaling up farming. This indirect “crop market channel” is likely strongest in remote areas, where non-migrant households live (Figure 2). Likewise, if shrinking farms of migrant households depress land prices, other village neighbours may expand cultivation through an indirect “land market channel”.
Building on this hypothesis, we expand our empirical framework to quantify how migration affects agricultural production through these market channels. We assume land markets operate within villages: as migrant households reduce cultivation following male emigration, local land prices fall, enabling non-migrant neighbours to expand production. For crop markets, we define zones within a state suitable for growing particular crops and measure crop market adjustments through aggregate emigration from these crop-suitable regions. Intuitively, if urban shocks trigger mass emigration from a rice-suitable region, lowering rice output and raising rice prices, then non-migrant households elsewhere in the state will expand rice production if they also live in a rice-suitable region.
We find that agricultural profits increase for non-migrant households through crop market adjustments, partially offsetting the agricultural losses accruing to migrant households. We also show that mass emigration from the crop market raises crop prices, prompting households unaffected by migration to spend more on agrochemicals, seeds, and equipment rentals, ultimately leading to higher production.
On the land market side, we observe that other farmers in the village who are less exposed to the migration shock expand their farms in response to land market adjustments, counteracting the downsizing of farms among migrant-sending households. We use land transaction data from IHDS to demonstrate that the mechanism is through lower land prices, which enables left-behind households in the village to expand cultivation.
Spatial reorganisation of agriculture
Our findings embed an important spatial dimension: the negative direct effect of migration on agriculture dominates for households near cities, where migration costs are low. The positive market-driven effects dominate for households further away, where migration costs are high. Put differently, although remote households are less likely to migrate, they still contribute to India’s structural transformation by producing more food. This leads to a spatial reorganisation of agriculture from migrant-sending areas toward remote areas.
Figure 4. Economic growth, worker exit, and agricultural growth (2001-2011)
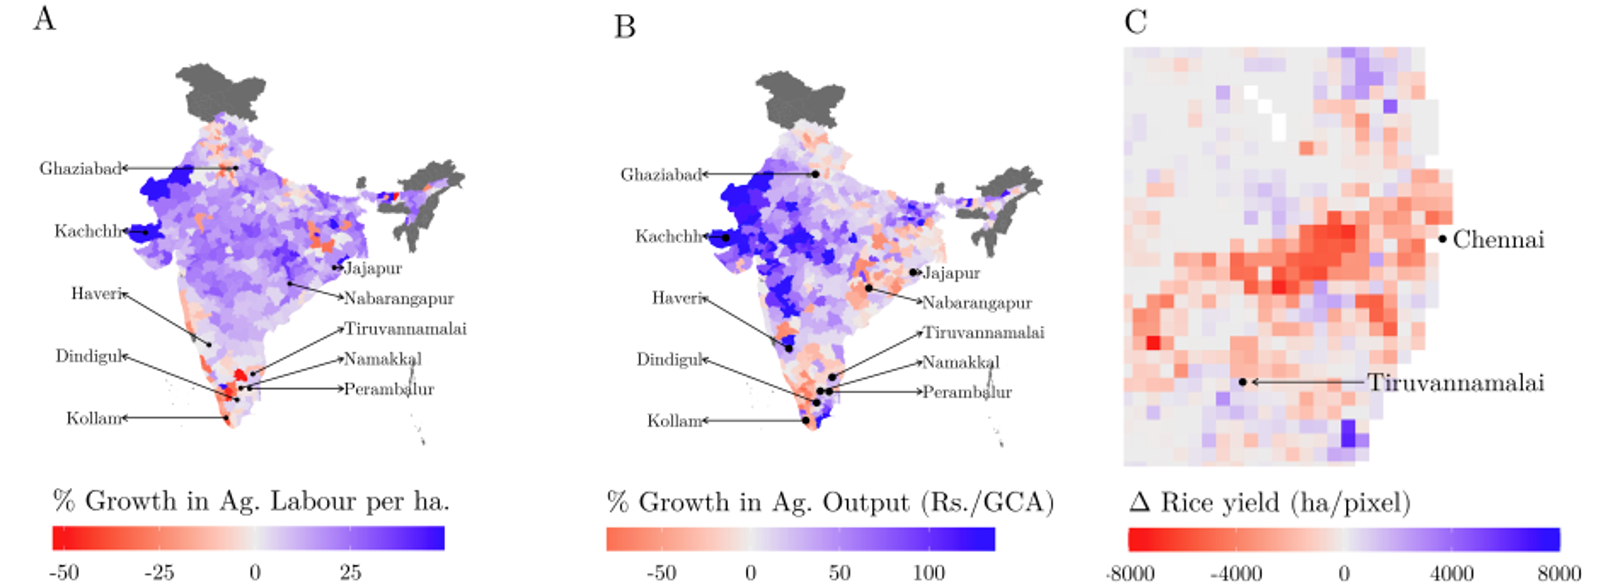
Notes/Sources: (i) The top 10 highest-growth cities are labelled. (ii) Panel A maps percentage change in agricultural workers per hectare of cultivated area, using data from the 2001 and 2011 Census. (iii) Panel B maps the percentage change in crop output, using data from the ICRISAT database. (iv) Output is measured as value of all crops produced in a district divided by gross cropped area. (v) Values (in both panels) are truncated at the 5th and 95th percentile. (vi) Panel C maps the change in harvested rice area per pixel from the GGCP10 satellite product.
We validate this spatial pattern using census and satellite data on income growth, agricultural employment, and crop output (Figure 4). At the district level, agricultural employment declines near high-growth cities (red), while crop output rises in remote districts (blue), mirroring our estimates of spatial reallocation through crop markets. High-resolution satellite data reveal a similar pattern even within a city: yields decline in peri-urban zones with high worker outflows (red) and rise in the outer fringes (blue), consistent with spatial reallocation through local land markets. Consistent econometric and visual evidence strengthens our claim that structural transformation reshapes the geography of agriculture.
Policy implications
We conclude with an accounting exercise to determine how much of the aggregate migration-induced agricultural losses are mitigated by the crop and land market adjustments. Using our estimates, we simulate aggregate crop value in the absence of migration, with migration but no market adjustments, with migration and land market but no crop market adjustments, and so on. Market adjustments mitigate 80% of aggregate agricultural losses due to emigration.
Our findings add important and policy-relevant value to our understanding of structural transformation. While worker reallocation does drive agricultural modernisation, it does not operate through direct capital substitution alone, but instead through market-mediated spatial reorganisation. Remote, non-migrant households adopt more technology and expand production, enabling them to benefit from a transformation they do not directly partake in. This suggests that structural change can redistribute gains toward the rural poor who stay behind.
Further Reading
- Alvarez-Cuadrado, Francisco and Markus Poschke (2011), “Structural Change Out of Agriculture: Labor Push versus Labor Pull”, American Economic Journal: Macroeconomics, 3(3): 127-158.
- Borusyak, Kirill, Peter Hull and Xavier Jaravel (2025), “A Practical Guide to Shift-Share Instruments”, Journal of Economic Perspectives, 39(1): 181-204.
- Foster, Andrew D and Mark R Rosenzweig (2022), “Are There Too Many Farms in the World? Labor Market Transaction Costs, Machine Capacities, and Optimal Farm Size”, Journal of Political Economy, 130(3): 636-680.
- Hornbeck, Richard and Suresh Naidu (2014), “When the Levee Breaks: Black Migration and Economic Development in the American South”, American Economic Review, 104(3): 963-990.
- Lewis, William Arthur (1954), “Economic Development with Unlimited Supplies of Labour”, The Manchester School, 22(2): 139-191.
- Madhok, R, N Frederik, AM Mobarak and O Deschenes (2025), ‘Internal Migration and the Spatial Reorganization of Agriculture’, NBER Working Paper No. 33854, National Bureau of Economic Research.
- Manuelli, Rodolfo E and Ananth Seshadri (2014), “Frictionless Technology Diffusion: The Case of Tractors”, American Economic Review, 104(4): 1368-1391.
- Mendola, Mariapia (2008), “Migration and technological change in rural households: Complements or substitutes?”, Journal of Development Economics, 85(1-2): 150-175.
- Rozelle, Scott, J Edward Taylor and Alan DeBrauw (1999), “Migration, Remittances, and Agricultural Productivity in China”, American Economic Review, 89(2): 287-291.